

Week of September 14, 2026

Published every Monday: Get a detailed snapshot of what moved the markets last week—and what to watch this week.

The bond market is sending a message.

Oil prices topped $100, and interest rates on U.S. Treasuries surged, leading to weakness in stocks and bonds. The energy sector rallied on a 9 percent increase in oil prices. Health care and materials were the weakest sectors. Bond markets were lower as yields on the 10-year Treasury approached 5 percent.

Weekly Quick Hits

Beyond the Headlines

The bond market is sending a message.

Report Releases

Producer and consumer inflation remain above the Federal Reserve’s (Fed’s) 2 percent target.

Financial Market Data

Stocks and bonds declined as oil topped $100; yields on U.S. Treasuries surged.

Looking Ahead

Expectations are for a rate hike after the Fed’s September meeting this week.

BEYOND THE HEADLINES:

The bond market is sending a message.

With 10-year Treasury yields approaching 5 percent, bond investors are clearly concerned about something. Several weeks ago, when U.S. debt topped $40 trillion, it appeared the bond market might be worried about the pace of government spending and the drag interest payments would continue to have on the economy. But rates have continued to move higher, as have West Texas Intermediate crude oil prices, which now exceed $100 per barrel.

The bond market seems to have concluded that the war in the Middle East is likely to continue, higher oil prices are here to stay, and inflation is an ongoing concern. At this week’s Federal Open Market Committee (FOMC) meeting, we’ll see whether the Fed shares the view of fixed income investors.

Inflation Reports Set the Stage
Last week’s Producer Price Index and Consumer Price Index—both of which exceeded economists’ expectations—indicated that inflation remains well above the central bank’s 2 percent target.

It can be argued that the drivers of the inflation upturn are temporary. The impact of tariffs and higher oil prices should eventually wane. In addition, other measures of inflation monitored by the central bank haven’t accelerated at the same rate, and long-term inflation expectations remain anchored closer to the Fed’s target. These factors aren’t likely to affect the Fed’s short-term decisions, but they may affect longer-term strategies.

A Stronger Economy?
Although it’s unlikely the bond market is focused on anything other than inflation at the moment, stronger economic growth could explain the move higher in yields. Spending on AI infrastructure remains strong, with levels estimated to exceed $1 trillion in 2027. That helps drive economic growth.

The U.S. economy managed to grow during the first two quarters of 2026 despite the many headwinds it has faced. And estimates for third-quarter gross domestic product (GDP) point to stronger growth. If yields are rising due to higher economic growth rather than inflation concerns, that’s a better sign for investors.

All Eyes on the News Conference
Given that market expectations are over 85 percent in favor of a rate increase on Wednesday afternoon, it will be surprising if the Fed doesn’t do so. At this point, holding rates steady could lead to a further rise in yields and increased volatility in equity markets.

Although Fed Chair Kevin Warsh has made it clear he doesn’t want to provide future guidance, market participants will pay close attention to the news release and Warsh’s comments in the post-meeting news conference. While the surge in bond yields could indicate that fixed income investors have already priced in multiple rate increases, it wouldn’t be as well received by equity investors. Any signs that this is a onetime rate increase, as opposed to the start of another increase cycle, should be well received.


“Given that market expectations are over 85 percent in favor of a rate increase on Wednesday afternoon, it will be surprising if the Fed doesn't do so. At this point, holding rates steady could lead to a further rise in yields and increased volatility in equity markets.

Report Releases: September 8-11, 2026

Producer Price Index (PPI):
August (Thursday)

Headline producer inflation accelerated last month, with the pace of year-over-year price growth rising to 5.4 percent. This marks six consecutive months with annual producer inflation exceeding 4 percent.

  • Actual monthly PPI/core PPI growth: +0.4%/+0.2%
  • Prior year-over-year PPI/core PPI growth: +4.8%/+4.3%
  • Expected year-over-year PPI/core PPI growth: +5.3%/+4.6%
  • Actual year-over-year PPI/core PPI growth: +5.4%/+4.6%

Consumer Price Index (CPI):
August (Friday)

Headline and core consumer inflation rose last month, due in part to higher prices for services. On a year-over-year basis, both measures remain well above the Fed’s 2 percent target.

  • Prior monthly CPI/core CPI growth: +0.1%/+0.2%
  • Expected monthly CPI/core CPI growth: +0.4%/+0.2%
  • Actual monthly CPI/core CPI growth: +0.4%/+0.3%
  • Prior year-over-year CPI/core CPI growth: +3.4%/+2.5%
  • Expected year-over-year CPI/core CPI growth: +3.4%/+2.4%
  • Actual year-over-year CPI/core CPI growth: +3.4%/+2.4%

Preliminary University of Michigan Consumer Sentiment Survey:
September (Friday)

Consumer sentiment reached a four-month low in September due in large part to rising short-term inflation expectations. That concern was reflected mostly in future expectations, with consumers anticipating budgetary pressure going forward.

  • Expected/prior month consumer sentiment: 51.0/51.7
  • Actual consumer sentiment: 47.8

The Takeaway


  • Producer and consumer inflation accelerated last month and remained well above the Fed’s 2 percent target.
  • It’s expected that the Fed will increase interest rates after its meeting on Wednesday.

Financial Market Data

Equity

Stocks were down broadly on concerns about military escalation in the Middle East, oil prices topping $100, and accelerating inflation. The Dow Jones Industrial Average had its worst week since March, declining 1.56 percent. The Nasdaq Composite and S&P 500 also dipped, though the communication services and technology sectors outperformed. The Russell 2000 declined more than 2 percent on rising rates. Crude oil prices rose 9 percent, leading to a 2 percent rally in the energy sector. Health care and materials were the weakest sectors, falling 3.5 percent and 2.7 percent, respectively. International developed markets were down more than 1 percent, while emerging markets were also down slightly.
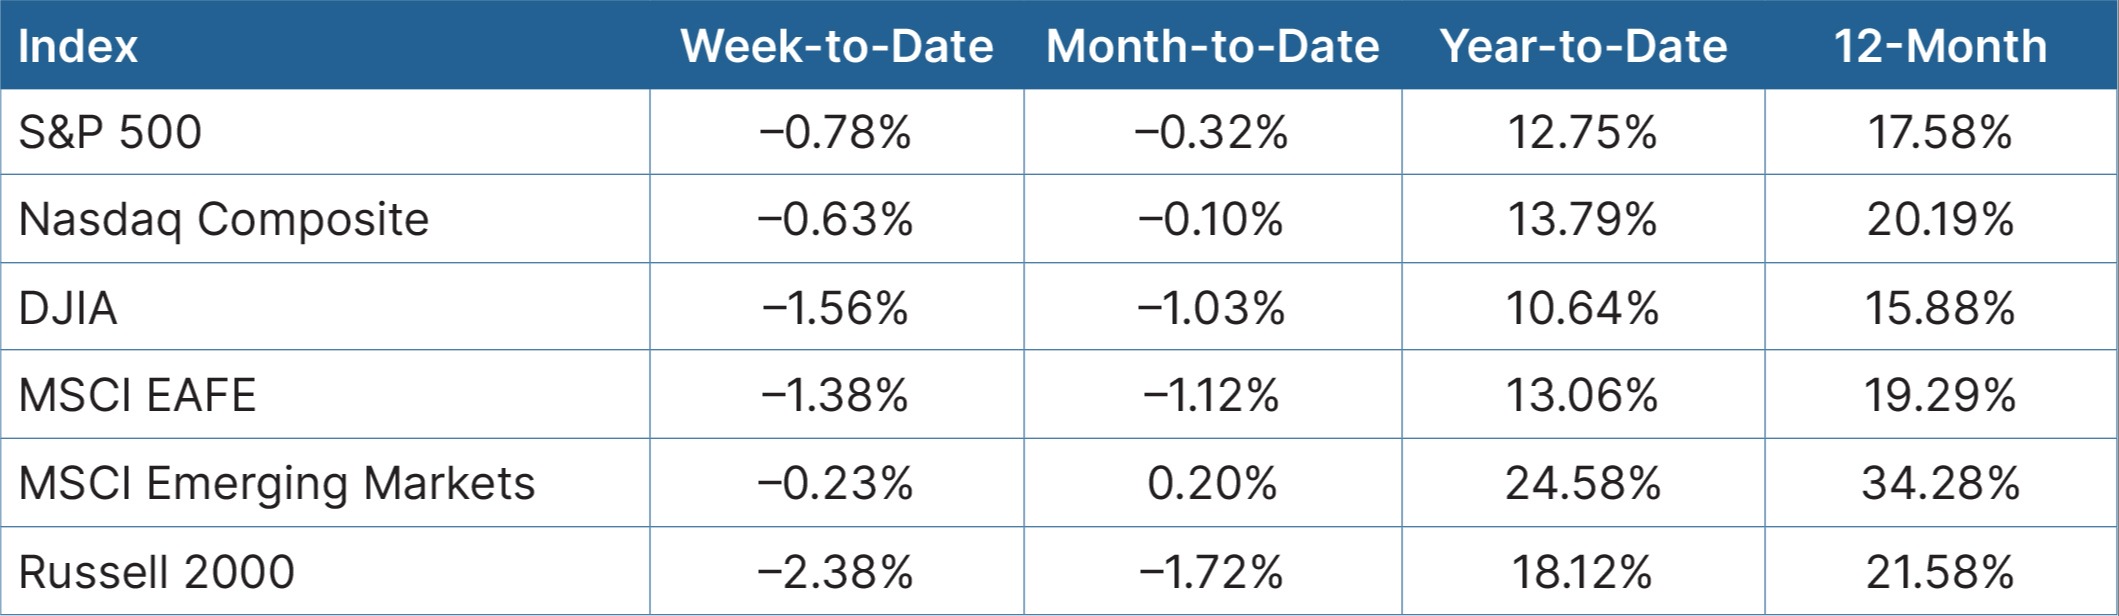
Source: Bloomberg, as of September 11, 2026

Fixed Income

Treasury bond yields surged as oil topped $100 per barrel and inflation reports showed consumer and producer prices moving higher while remaining well above the Fed’s 2 percent target. Short-term rates rose 24–28 basis points (bps), and the 10-year yield closed at 4.98 percent. As a result, fixed income markets were broadly lower. Core bonds and Treasuries were each down roughly 1 percent, and mortgages declined nearly 1.5 percent. Municipal bonds were down more than 1 percent.
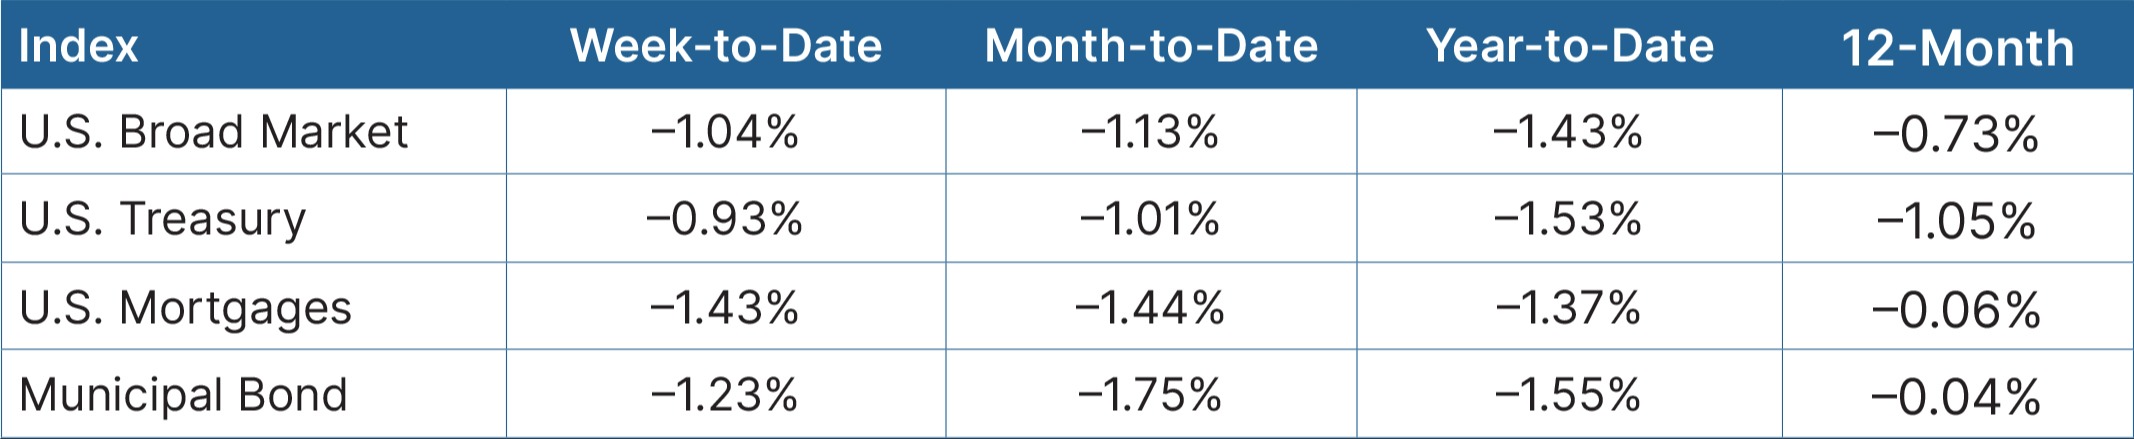
Source: Bloomberg, as of September 11, 2026

The Takeaway


  • Crude oil prices rallied 10 percent, helping the energy sector lead all sectors.
  • Fixed income markets were lower as Treasury yields surged on higher oil prices and accelerating inflation.

Looking Ahead

Economists and investors will focus on the September FOMC meeting, which concludes Wednesday. Markets expect the Fed to increase interest rates 25 bps.

  • The week kicks off on Wednesday with advance retail sales for August and the National Association of Home Builders (NAHB) Housing Market Index for September. Retail sales are expected to rebound after a sharp decline in July, and home builder confidence is set to fall modestly.
  • Also on Wednesday, we expect the FOMC rate decision for September. Over the past few weeks, market expectations for a rate hike have risen considerably and now sit at more than 85 percent.
  • Finally, on Thursday, we’ll receive an update on housing starts and building permits for August. Housing starts are expected to rise and permits are set to fall. These measures of new home construction have been volatile recently due to rising interest rates and material prices.

Disclosure: This material is intended for informational/educational purposes only and should not be construed as investment advice, a solicitation, or a recommendation to buy or sell any security or investment product. Diversification does not assure a profit or protect against loss in declining markets, and diversification cannot guarantee that any objective or goal will be achieved. Please contact your financial professional for more information specific to your situation.

Bonds are subject to availability and market conditions; some have call features that may affect income. Bond prices and yields are inversely related: when the price goes up, the yield goes down, and vice versa. Market risk is a consideration if sold or redeemed prior to maturity.

Certain sections of this commentary contain forward-looking statements that are based on our reasonable expectations, estimates, projections, and assumptions. Forward-looking statements are not guarantees of future performance and involve certain risks and uncertainties, which are difficult to predict. All indices are unmanaged and are not available for direct investment by the public. Past performance is not indicative of future results. The S&P 500 is based on the average performance of the 500 industrial stocks monitored by Standard & Poor’s. The Nasdaq Composite Index measures the performance of all issues listed in the Nasdaq Stock Market, except for rights, warrants, units, and convertible debentures. The Dow Jones Industrial Average is computed by summing the prices of the stocks of 30 large companies and then dividing that total by an adjusted value, one which has been adjusted over the years to account for the effects of stock splits on the prices of the 30 companies. Dividends are reinvested to reflect the actual performance of the underlying securities. The MSCI EAFE Index is a float-adjusted market capitalization index designed to measure developed market equity performance, excluding the U.S. and Canada. The MSCI Emerging Markets Index is a market capitalization-weighted index composed of companies representative of the market structure of 26 emerging market countries in Europe, Latin America, and the Pacific Basin. The Russell 2000® Index measures the performance of the 2,000 smallest companies in the Russell 3000® Index. The Bloomberg US Aggregate Bond Index is an unmanaged market value-weighted performance benchmark for investment-grade fixed-rate debt issues, including government, corporate, asset-backed, and mortgage-backed securities with maturities of at least one year. The U.S. Treasury Index is based on the auctions of U.S. Treasury bills, or on the U.S. Treasury’s daily yield curve. The Bloomberg US Mortgage Backed Securities (MBS) Index is an unmanaged market value-weighted index of 15- and 30-year fixed-rate securities backed by mortgage pools of the Government National Mortgage Association (GNMA), Federal National Mortgage Association (Fannie Mae), and the Federal Home Loan Mortgage Corporation (FHLMC), and balloon mortgages with fixed-rate coupons. The Bloomberg US Municipal Index includes investment-grade, tax-exempt, and fixed-rate bonds with long-term maturities (greater than 2 years) selected from issues larger than $50 million. One basis point is equal to 1/100th of 1 percent, or 0.01 percent.

Authored by the Investment Research team at Commonwealth Financial Network®.

© 2026 Commonwealth Financial Network®

Let’s Talk About Your Financial Future

Whether you’re navigating a volatile market or preparing for the future, we’re here to help.

Schedule a Consultation